A modern, configurable view of your Opera data. Analyse performance, trends and key figures without exporting to spreadsheets. Every dashboard is fully customisable to your role and your business.
Explore a working dashboard with sample data. No sign-up required.
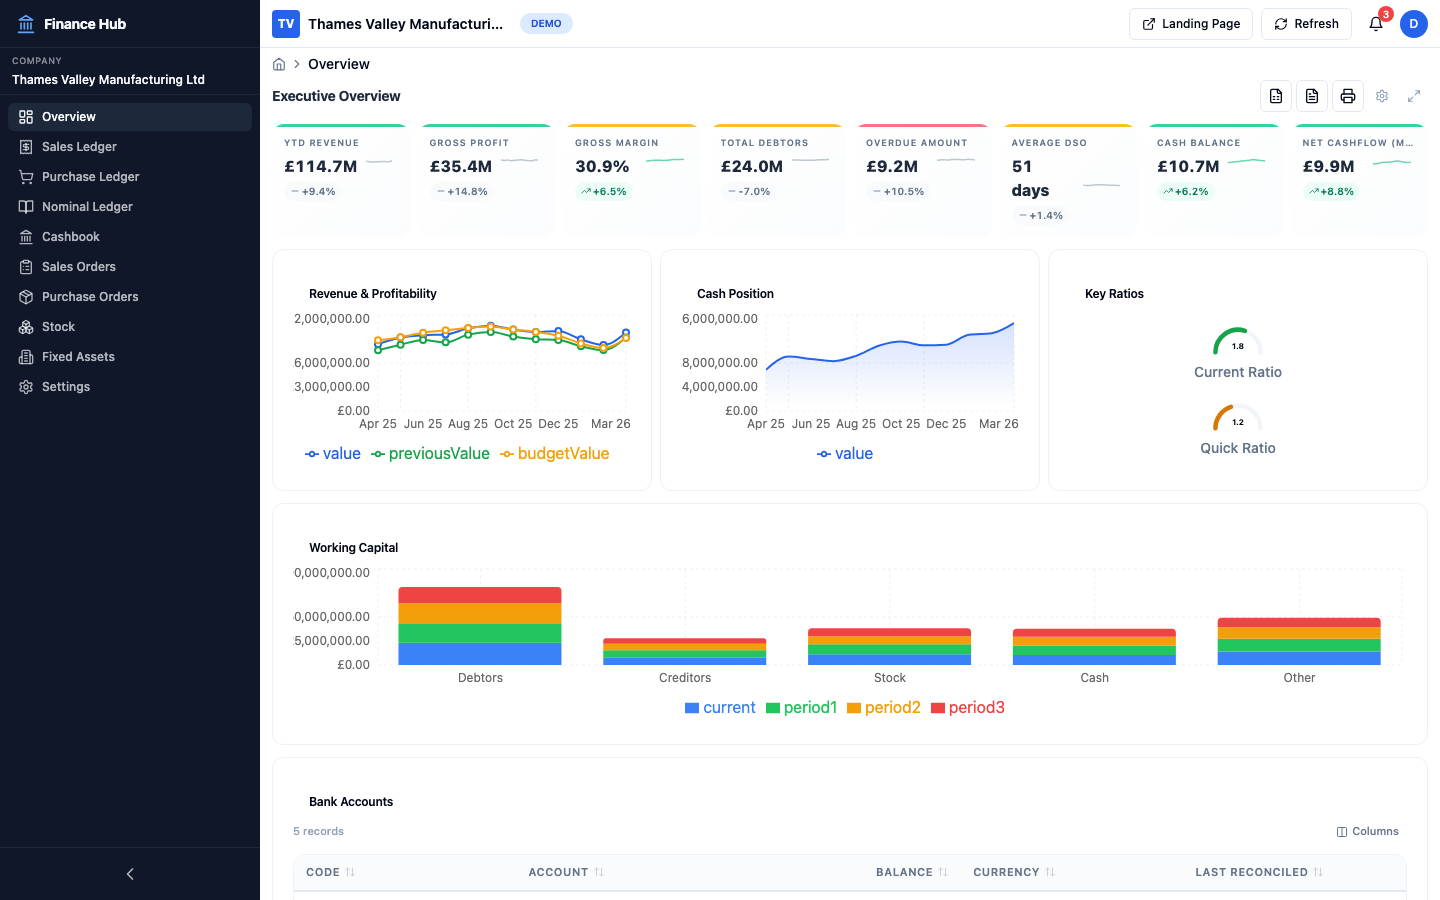
No more exporting to Excel to see what's going on. Each dashboard gives you real-time answers from your Opera data.
The financial health of your business at a glance — no waiting for month-end reports
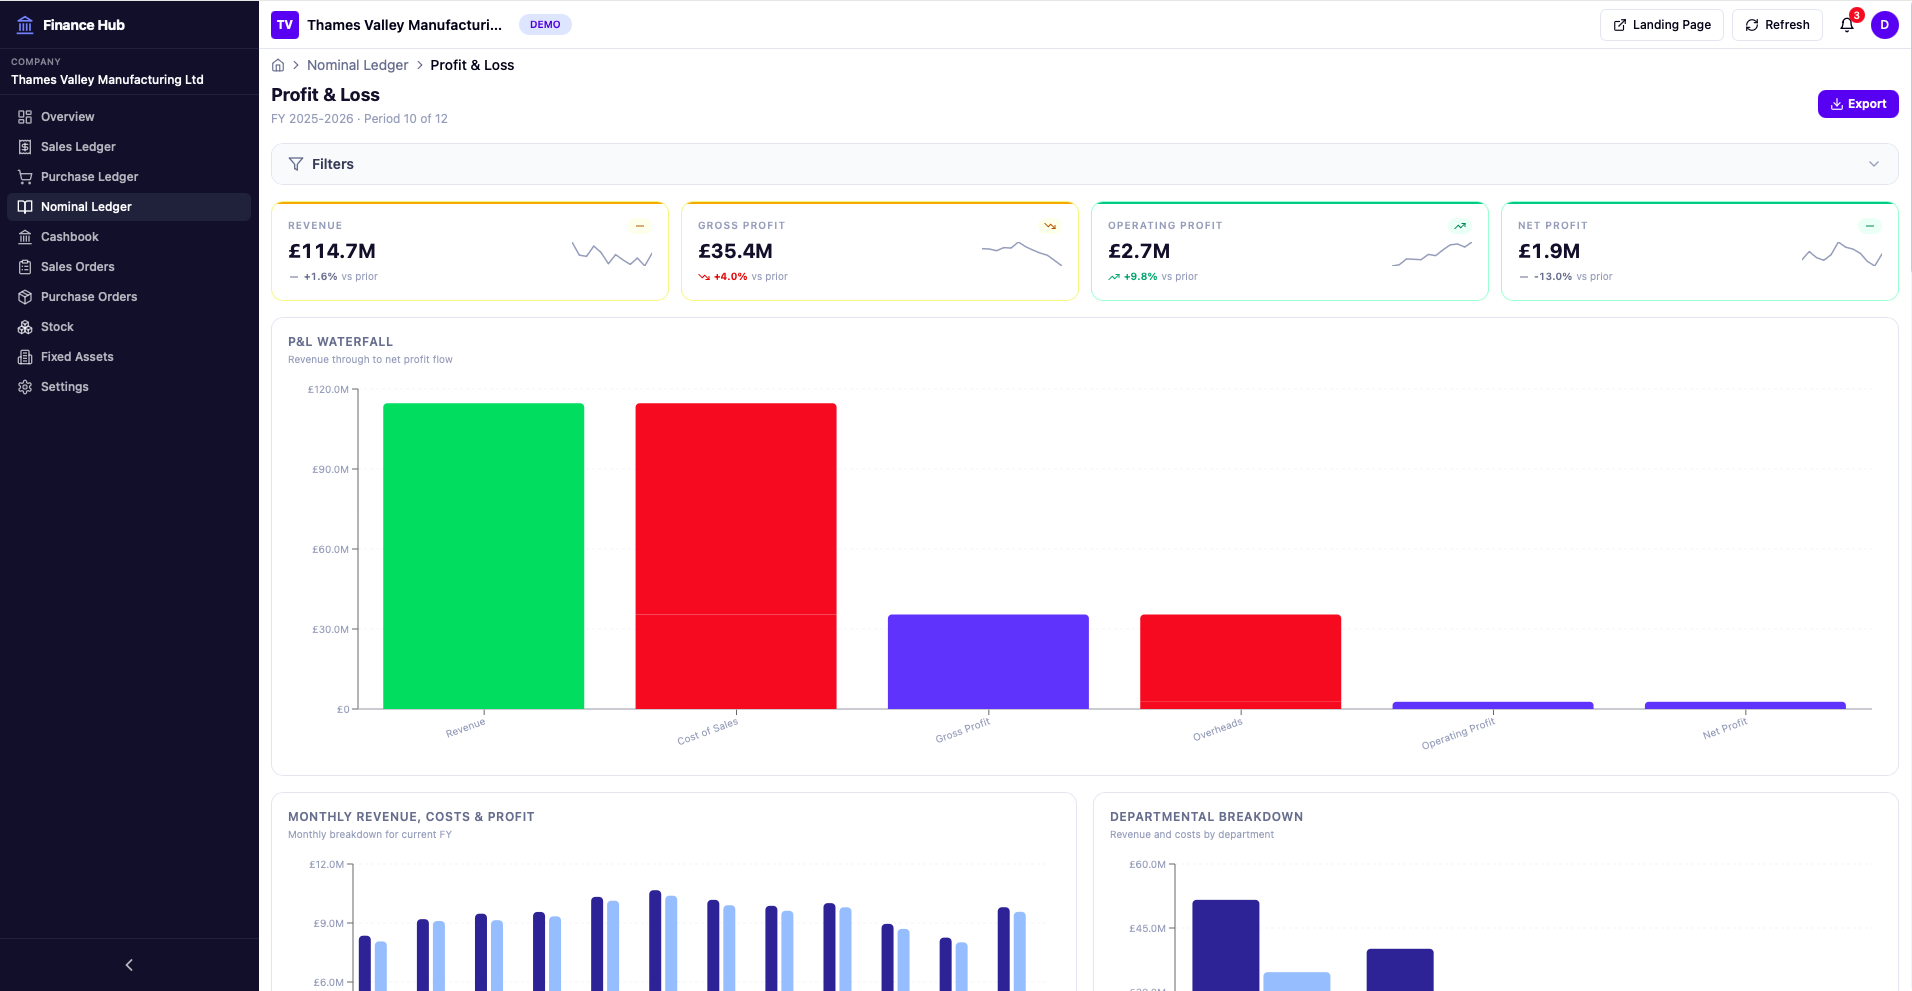
P&L, balance sheet, and trial balance — drill into any figure without opening a spreadsheet
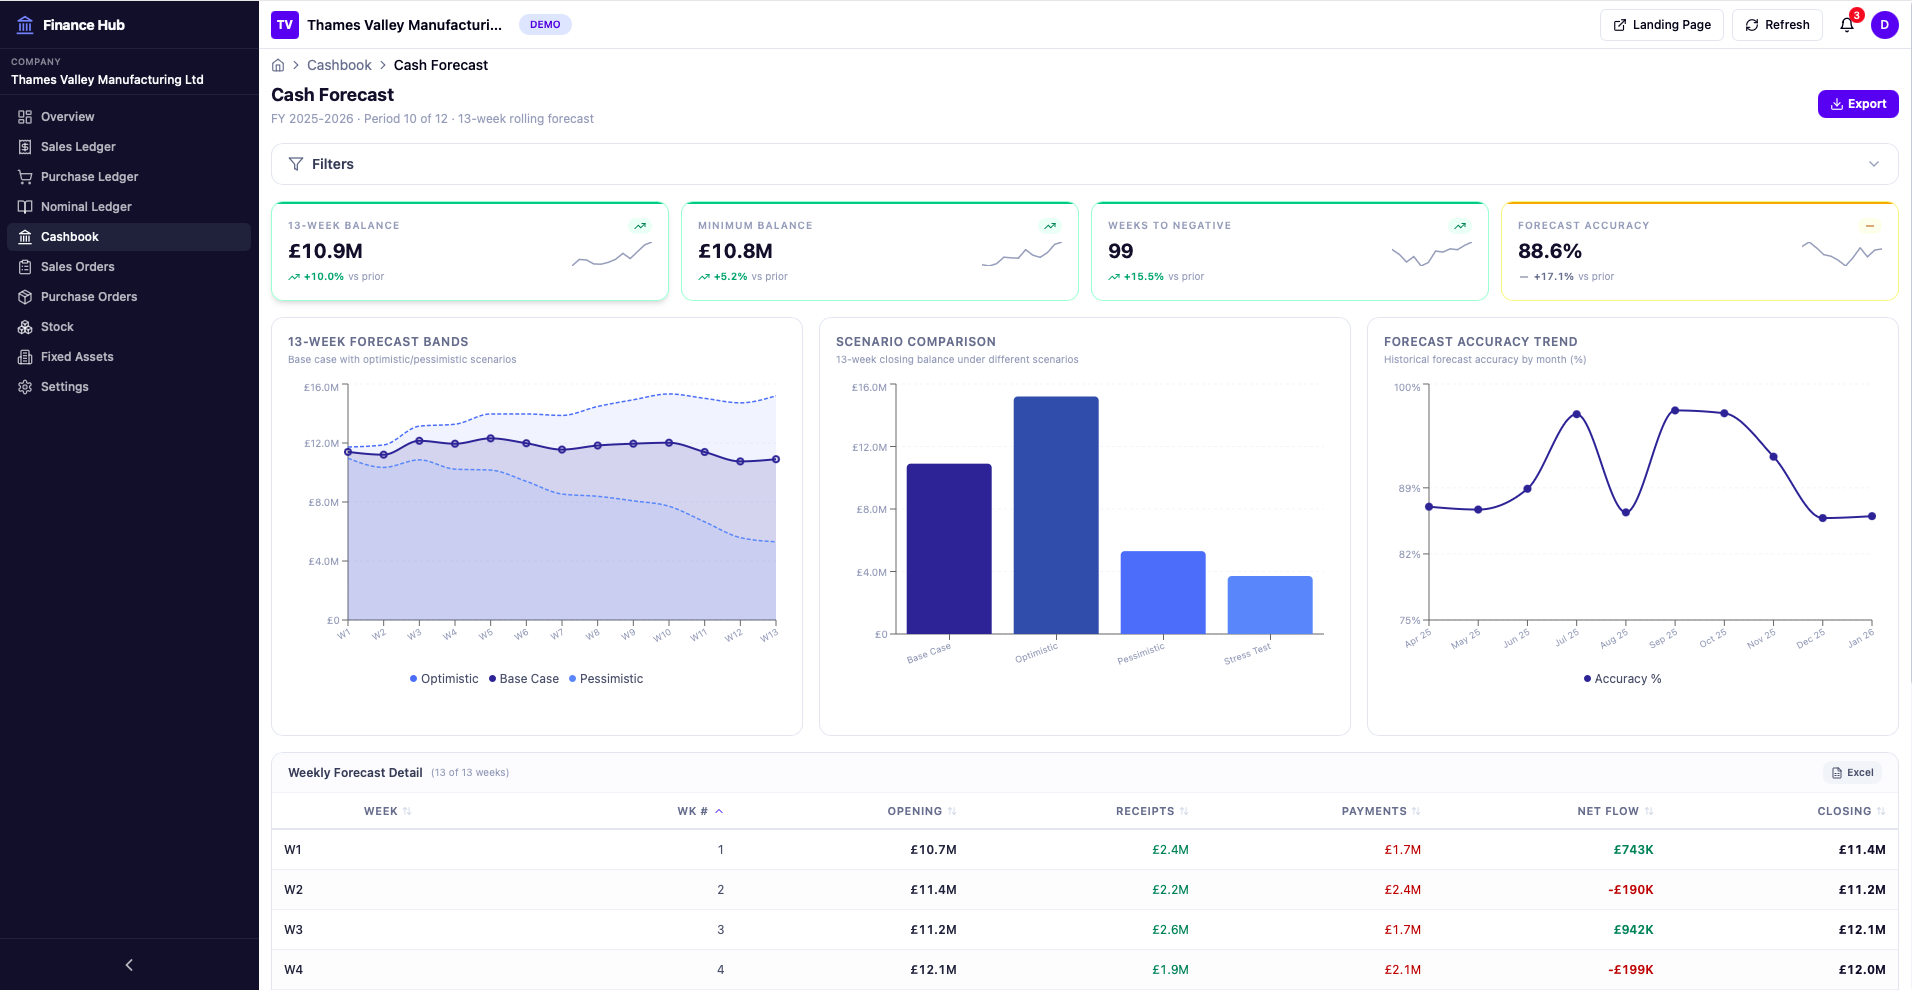
See your cash position in real time — bank balances, cash flow, and reconciliation status
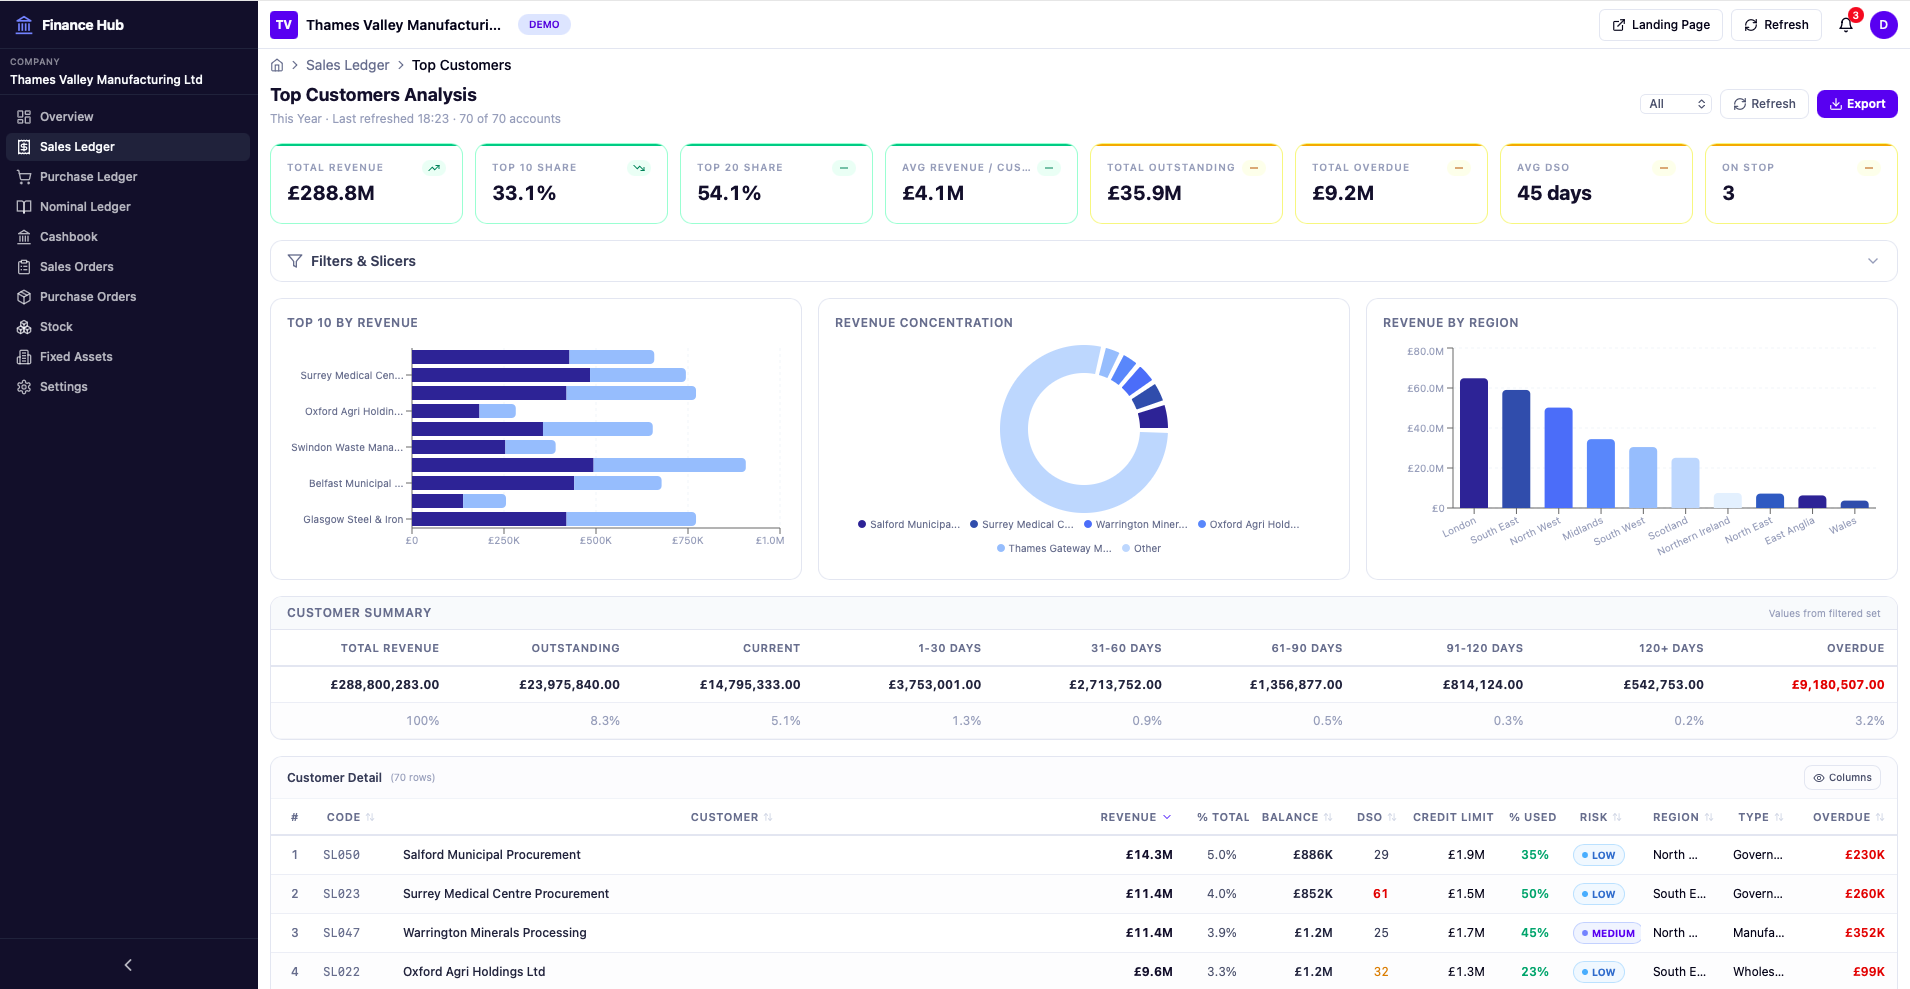
Spot overdue accounts instantly — aged debtors, customer trends, and collection priorities
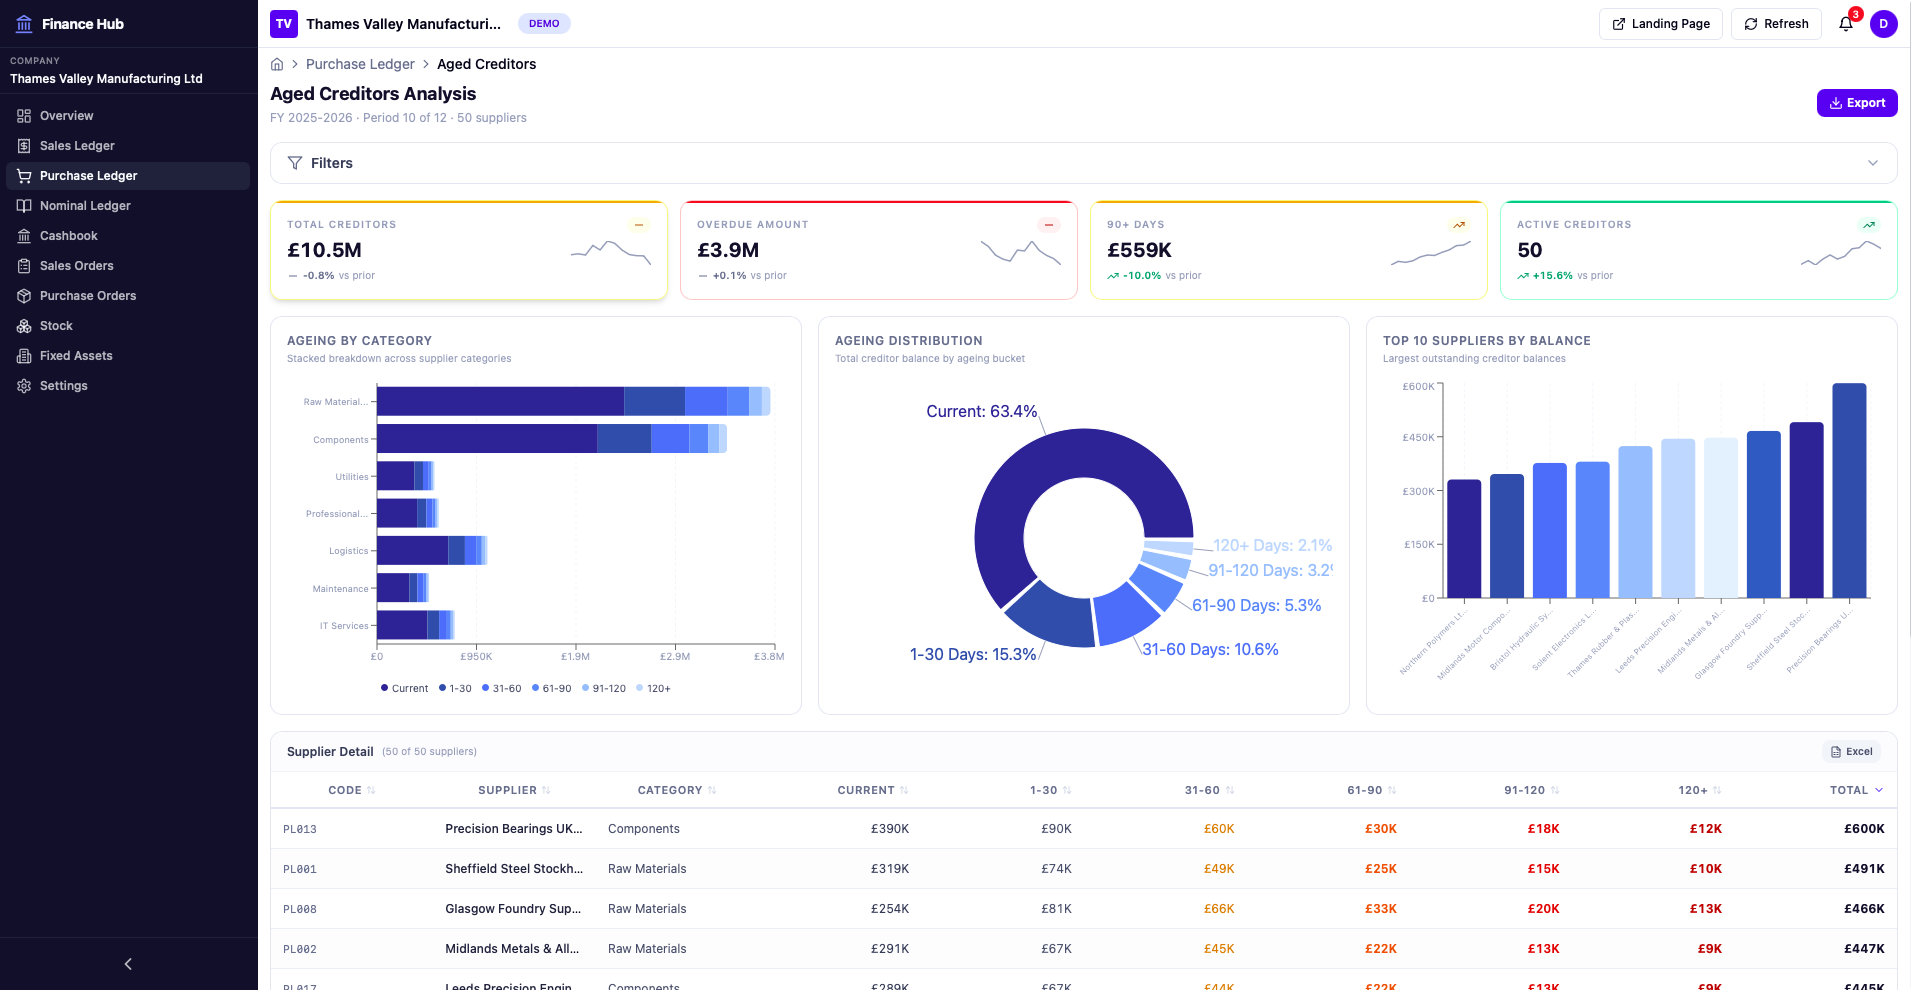
Know exactly what you owe and when — aged creditors, supplier spend, and payment priorities
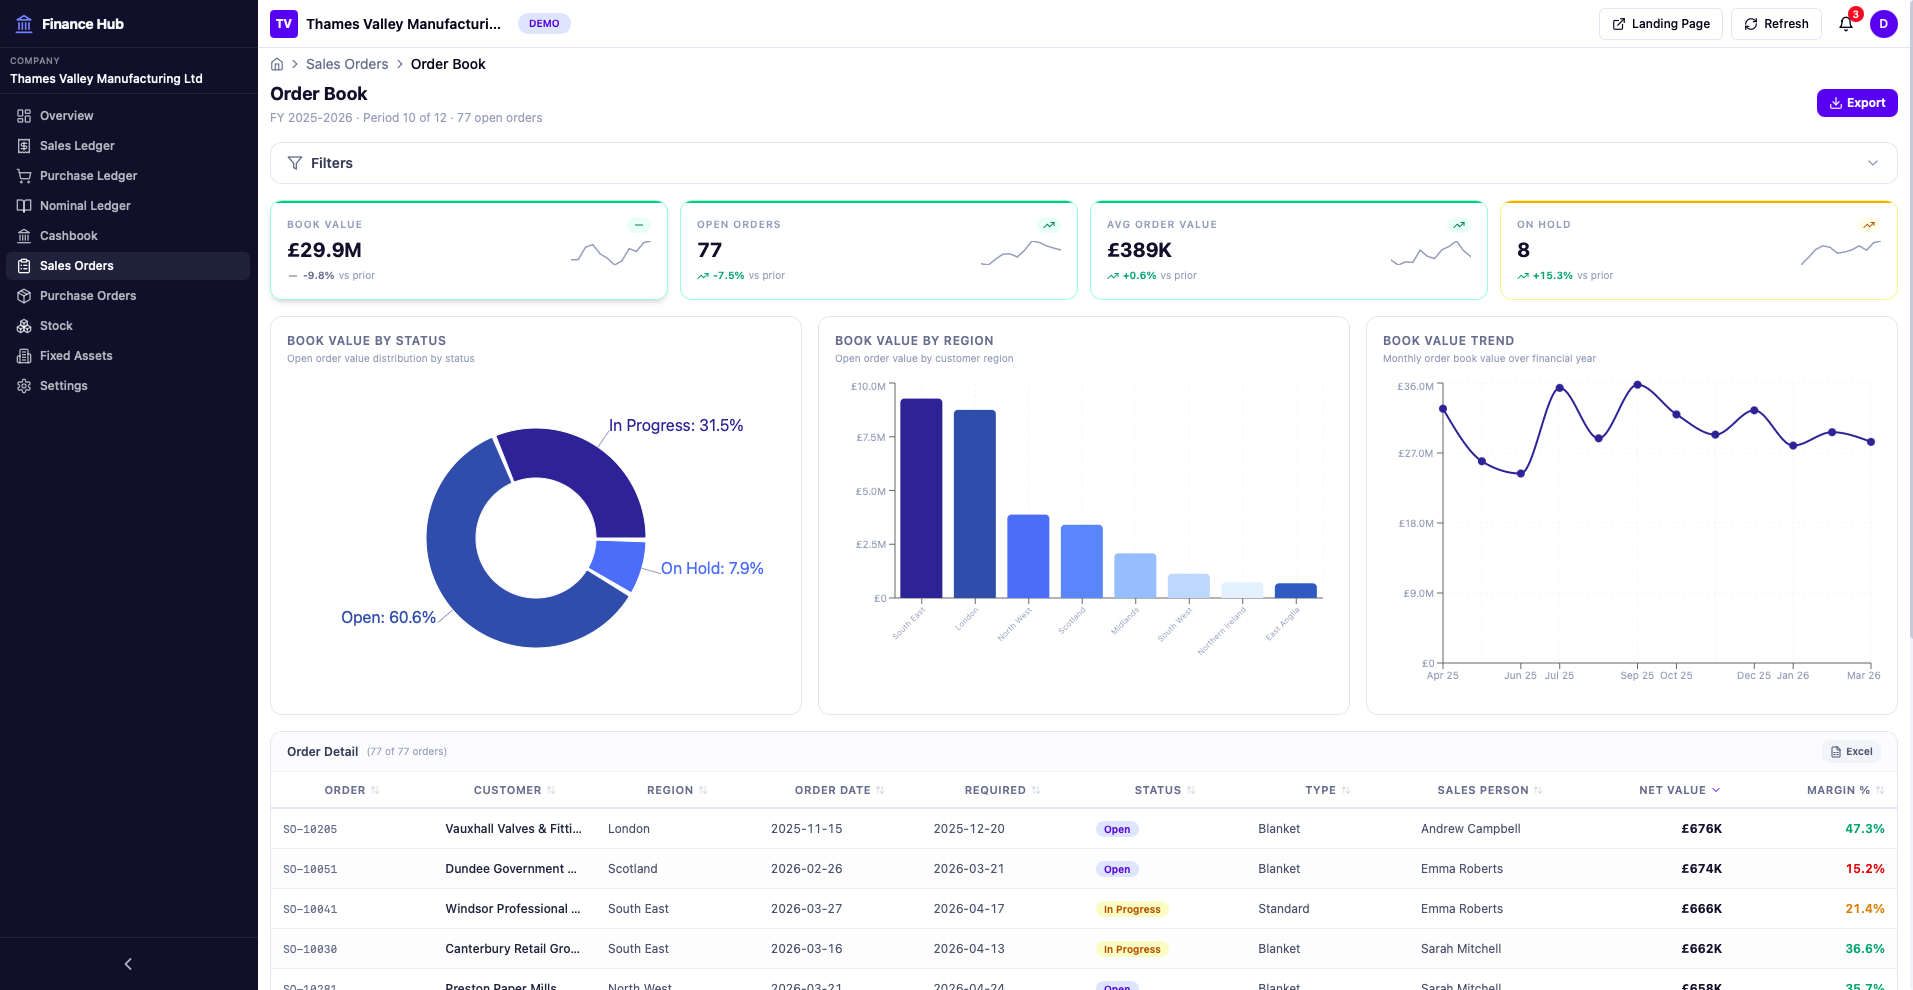
Track your pipeline and delivery performance — see what's sold, what's shipped, and what's outstanding
Every dashboard is configurable. Arrange widgets, set filters, choose date ranges, and save views for your role. No two users need to see the same thing.
Finance directors see the executive overview. Credit controllers see aged debtors. Each team member gets a dashboard tailored to their responsibilities.
Click any chart, any number, any row to drill into the underlying data. From summary to transaction in seconds.
Add, remove, resize and rearrange dashboard widgets. Choose from charts, tables, KPI cards, trend lines and more.
Dashboards pull directly from your Opera database in real time. No nightly exports, no CSV uploads, no stale data.
The Crakd Gateway connects securely to your Opera database. Dashboards read data in real time through optimised queries. No data is copied or stored externally.
See how your Opera data looks in real-time dashboards — no spreadsheets, no exports.